Tuesday, October 19, 2010

Lab 4


GIS has a lot of potential, in addition to many potential pitfalls.  The potential of GIS is the exploration of different geographic interactions.  For example, GIS has made it possible for businesses to find where things such as marketing, resources, and customers are most effective and/or readily available.  In addition, it helps policy-makers find where voters are active or donating money.  In addition, GIS links data and maps, and it  helps create a visual aid for various different types of information.  From showing where the most McDonald's are located in the US to where the most casualties in Iraq are, GIS enables the user to see data in a geospatial context. 

GIS has also allowed for the expansion of the types of information given in maps.  Topological maps include data about elevations in addition to the location of places, freeways, and waterways.  In addition geocoding allows finding locations based on ZIP codes or addresses.  Recently GIS has become available in cars and on mobile devices, allowing users to be able to access information about their location both nominally and absolutely almost any time they want to.  Furthermore, mapping things such as resource depletion and the occurence of crimes can help people live better and safer lives. 

The potential pitfalls of GIS include issues with privacy.  For example, the fundrace maps shown in lecture allow users to access the name, address, occupation, and dollar amount of political donations.  For more controversial issues such as California's prop 8, this type of information could lead to danger for the people featured in the map.  The growth of neogeography with software such as GoogleMaps, anybody can make a map of anything they want, and the validity of the information is hard to verify.  In addition, copyright and privacy issues can also arise.

Furthermore, as we know more and more about what is around us, we realize how little we know (the paradox of context).  We also like to know about others and the world around us but would rather others not know the same information about us (the problem of transparency).  These two issues are not easily reconciled by GIS, because it expands and visually represents the amount of information we have about the world around us.  It is an important tool for businesses, agriculture, education, and many other disciplines, but as with all of technology, the source and the information presented should be carefully looked at to ensure validity and protection of privacy. 

Tuesday, October 12, 2010

Lab 3


View La Liga Stadium Locations and Names in a larger map


http://maps.google.com/maps/ms?ie=UTF8&hl=en&msa=0&msid=101072126278466890908.0004926e6705ae6777e1f&ll=39.546412,-3.922119&spn=6.10677,9.876709&z=7

The Google Map I created shows the teams of the Spanish futbol league, La Liga. In this dynamic map, each icon represents a Spanish team, and shows the city the team plays in.  In the caption for each icon, the name of the stadium the team plays at is included.  There is a point on the map indicating Barcelona, because they are the defending La Liga champions.  There is also a line connecting Madrid and Barcelona, because they are the two major contenders for the La Liga championship, and are historically the strongest teams in the league.  There is a video link embedded for the Barcelona point, showing a video tour of Camp Nou (the video is shown as a link because the video was not embedding properly).  There is also an embedded image of the Real Madrid stadium under the icon that represents Real Madrid.

Pitfalls and potential consequences of neogeography include misinformation or potentially harmful information being presented.  Similar to the example given in class, if there are dynamic maps with the names of people who give political donations, it could lead to hate crimes or harassment.  In addition, when people make their own maps they can provide intentional misinformation.  My own map gives a good schematic of where each team plays, and locates them by the city they  play in, and names the stadium.  This provides someone with enough information to look up on their own the stadium and find its exact address, cost of tickets to games, etc.  The icons on the map do not show the stadium at its exact street location, because that is not the general purpose of the map, however, some may find that more helpful.  Nonetheless, neogeography has the potential to increase the information we have available immensely, as long as the user is aware and cognizant of the information being presented.

Tuesday, October 5, 2010

Lab 2

1. The name of the quadrangle is Beverly Hills.
2.  The names of the adjacent quadrangles are Van Nuys,Topanga, Hollywood, and Venice.
3. The first quadrangle was created in 1879.
4. The datum used to create this map includes: imagery taken in 1978, selected hydrographic data from NOS/NOAA chart in 1964, projection and 1000-meter grid, North American Datum of 1927 and 1983, California coordinate system of 1927, and Universal Transverse Mercator, zone 11. 
5. The scale of the map is 1:24,000.
6.  a. 120 Meters b. 1.89 miles c. 2.64 inches d. 12.5 centimeters
7. The contour interval is 20 feet.
8. a. Public Affairs Building - 118 degrees 26 minutes (longitude) 34 degrees 2 minutes 30 seconds (latitude) in degrees: 118.433 and 34.0367
b. tip of Santa Monica pier - 118 degrees 30 minutes 10 seconds (longitude)  34 degrees 0 minutes 30 seconds (latitude) in degrees: 118.503 and 34. 0083
c. upper Franklin Canyon Resevoir - 118 degrees 25 minutes 10 seconds (longitude) 34 degrees 6 minutes (latitude) 118.419 and 34.1
9. a. 580 feet b. 140 feet c. 700 feet
10. zone 11
11. 11S 0361250 3763050
12. 1000000 square meters
13.

14. The magnetic declination of the map is 14 degrees.
15. west to east
16.
.

Tuesday, September 28, 2010

Lab 1

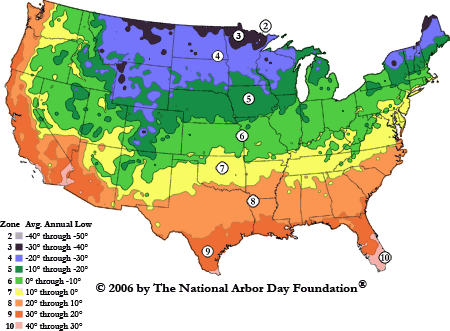
2006 
Arborday.org Hardiness Zones
The map above is from the Nation Arbor Day Foundation website, www.arborday.org. I found it while searching google images for "maps of the US." Given the recent heatwave, I thought a map of the average temperature lows in the United States would remind me of better times.  The map shows the borders of the continuous 48 states.  There are different colored areas on the map corresponding to different annual temperature lows. The temperatures each color represents are indicated in the legend.  There are no major cities or landmarks listed on the map.  I find it interesting that Hawaii and Alaska were omitted from the map, because I searched for a map of the United States without specifying the continuous 48 states.  Also, as you go from north to south the average lows increase. I also find it interesting that the states are not labeled in any way, because it makes it difficult for those who are less familiar with states they do not live in.
Map of U.S. showing the drug corridors as described in the 
following text.
This map is from the National Drug Intelligence Center website http://www.justice.gov/ndic/pubs11/18862/transport.htm.  I also found this map while searching for maps of the US on google.  The map shows the borders of the 48 continuous states and includes some major freeways and major cities including New York, Boston, Philadelphia, San Diego, and Los Angeles. The size of the major city in terms of population is indicated by the size of the square representing it.  The colors on the map correspond to different drug corridors used by drug dealers to transport drugs from distribution centers to market areas.  I found this map interesting because I had never seen a map of drug corridors, nor had I really ever thought about drug corridors.  I also think it is interesting that most of the corridors head from north to south.  Corridor B and C are the only ones that are east to west. 


Site map
I also found this map while searching google for maps of the US.  It is from the world atlas website, http://northamerica.theworldatlas.net/united-states/map.html.  The map does not show the borders of the states, but shows the border of the United States with Canada and Mexico.  The map shows major cities including Detroit, Chicago, San Francisco, New York, Boston, Washington D.C., Miami, New Orleans, and Houston.  The map includes the major rivers and bodies of water in the United States.  It also includes the major mountain chains, including the Cascades, and the Sierra Nevadas. Some of the smaller rivers are not indicated by name.  I find it very interesting that although there is no key or legend for this map, it can be assumed that the browner regions are drier than the green regions.  In addition, the shading on the map helps visualize elevations.