 |
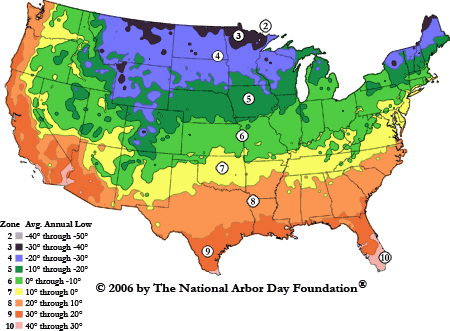
| The map above is from the Nation Arbor Day Foundation website, www.arborday.org. I found it while searching google images for "maps of the US." Given the recent heatwave, I thought a map of the average temperature lows in the United States would remind me of better times. The map shows the borders of the continuous 48 states. There are different colored areas on the map corresponding to different annual temperature lows. The temperatures each color represents are indicated in the legend. There are no major cities or landmarks listed on the map. I find it interesting that Hawaii and Alaska were omitted from the map, because I searched for a map of the United States without specifying the continuous 48 states. Also, as you go from north to south the average lows increase. I also find it interesting that the states are not labeled in any way, because it makes it difficult for those who are less familiar with states they do not live in. |
 |
| This map is from the National Drug Intelligence Center website http://www.justice.gov/ndic/pubs11/18862/transport.htm. I also found this map while searching for maps of the US on google. The map shows the borders of the 48 continuous states and includes some major freeways and major cities including New York, Boston, Philadelphia, San Diego, and Los Angeles. The size of the major city in terms of population is indicated by the size of the square representing it. The colors on the map correspond to different drug corridors used by drug dealers to transport drugs from distribution centers to market areas. I found this map interesting because I had never seen a map of drug corridors, nor had I really ever thought about drug corridors. I also think it is interesting that most of the corridors head from north to south. Corridor B and C are the only ones that are east to west. |
 |
| I also found this map while searching google for maps of the US. It is from the world atlas website, http://northamerica.theworldatlas.net/united-states/map.html. The map does not show the borders of the states, but shows the border of the United States with Canada and Mexico. The map shows major cities including Detroit, Chicago, San Francisco, New York, Boston, Washington D.C., Miami, New Orleans, and Houston. The map includes the major rivers and bodies of water in the United States. It also includes the major mountain chains, including the Cascades, and the Sierra Nevadas. Some of the smaller rivers are not indicated by name. I find it very interesting that although there is no key or legend for this map, it can be assumed that the browner regions are drier than the green regions. In addition, the shading on the map helps visualize elevations. |